custom report development
Strategic
Operational
Operational

Strategic reports are commonly used to align a company’s strategic goals. They track performance metrics against enterprise-wide targets. As a result, these reports tend to summarize performance over set time frames: past month, quarter or year.
Though they can provide opportunities for drill down and further analysis, strategic reports are usually fairly high-level.
HarborView can automate the preparation of Management Review reports so you never have to cut and paste again!
Operational
Operational
Operational
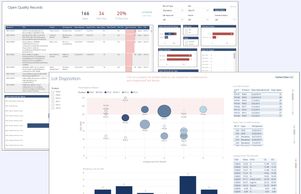
Operational reports are the most used report. They monitor and analyze a company’s activities in a given business area. These reports are focused on exception alerting and are based on real time data. Operational reports are used by those with operational responsibilities. This often leads to more direct action, then further analysis. Because of this, operational reports often are more detailed than strategic reports.
Operational reports help departments stay proactive and ahead of problems. For example, a manufacturing firm may use an operational report to track products manufactured along with the number of defects, complaints or returns. With a report , any adverse trends would be highlighted in real time.
Operational reports are designed to be viewed multiple times throughout the day. They are often used to monitor progress towards a target
Analytical
Operational
Analytical
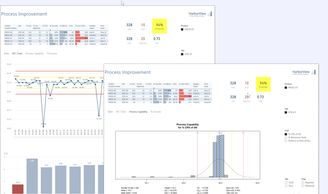
An analytical report is used to analyze large volumes of data to allow users to investigate trends, predict outcomes, and discover insights. The data behind an analytical report needs to be accurate and may only be updated infrequently. Analytical reports often include advanced BI features like drill-down and ad-hoc querying.
An example of an analytical report is one that monitors process capability or method variability to facilitate process improvement